
On this pageTable of contents+
- What Google Trends measures
- How to interpret the relative 0–100 index
- How to use Google Trends
- Google Trends Home
- Explore
- Trending Now
- Analyze seasonality and long-term direction
- Analyze long-term trends
- Analyze seasonal patterns
- Find new market opportunities
- Method 1: investigate rising and breakout queries
- Method 2: test regional opportunity
- Method 3: explore adjacent categories
- Method 4: turn audience questions into product hypotheses
- Use relative interest in keyword research
- Apply Google Trends to an SEO strategy
- Use Trends for competitor research carefully
- Apply Trends to cross-border ecommerce
- Use Trends to improve marketing timing
- Coordinate paid campaigns and content
- Optimize paid-search timing
- Optimize the content calendar
- Practical techniques for efficient analysis
- Use punctuation and groups deliberately
- Why interest can display as zero
- How to handle volatile long-tail charts
- Reduce information overload
- Compare countries and regions consistently
- Read the search-interest index correctly
- Use Trends for product research
- Build a reproducible Trends analysis
- Know when to use another keyword tool

Google Trends can show how search interest changes over time, where it is relatively concentrated and which related queries are rising. Used carefully, it can improve keyword research, content timing, market exploration and campaign planning.
It is not a secret source of absolute demand. Trends uses sampled, normalized search data, so its charts should be read as comparative evidence and checked against search-volume, commercial and first-party data before a major decision.
What Google Trends measures
Google Trends analyzes relative interest in a search term or topic for a selected time, place, category and Google search surface. It can help ecommerce teams, publishers and advertisers see when interest changes and which related subjects deserve further research.
Google describes the underlying data as a largely unfiltered sample of actual search requests that is anonymized, categorized and aggregated. That makes the tool useful for patterns, but not a complete record of every search.
How to interpret the relative 0–100 index
The 0–100 chart is the foundation of any Trends analysis. It does not report the absolute number of searches:
- 100 marks the point of highest relative interest within the selected comparison.
- 50 means the relative interest is half the peak value in that comparison.
- 0 means the term has too little data for Trends to display, not necessarily that nobody searched for it.
Google first divides each data point by all searches in the chosen geography and period, then scales it to a range of 0 to 100. Two regions with the same index can therefore have very different total search volumes. See Google's Trends data FAQ.
For example, if interest in World Cup reaches 100 in July and 30 in August, 30 means 30% of the July peak within those settings. It does not mean there were only 30 searches.
Use Keyword Planner or another suitable source when you need an estimate of monthly search volume. Trends measures search interest; it is not a sentiment survey and does not say whether attention is positive or negative.
How to use Google Trends
Google Trends Home
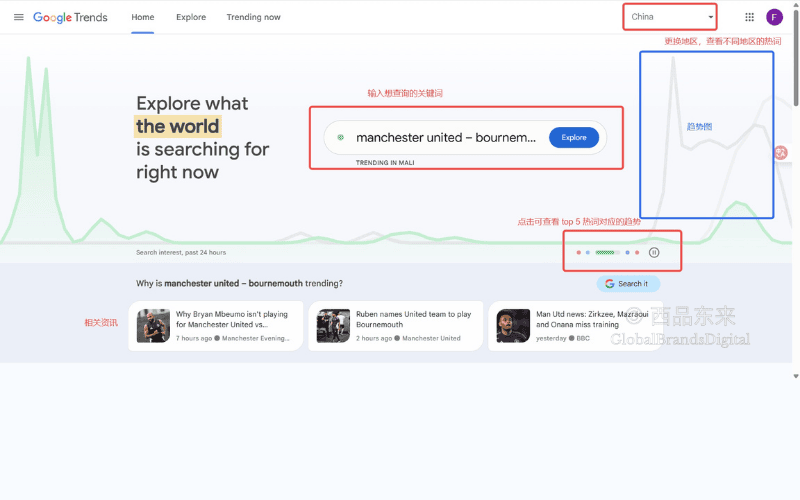
The home page provides entry points into Explore and current search trends. It is useful for orienting yourself, checking which markets are available and moving quickly into a defined comparison.
The interface changes over time, so treat the screenshots as a guide to the main areas rather than a permanent map of every control.
- Current search activity: browse topics or queries that are attracting unusual recent interest in supported markets.
- Trend context: review charts and related news where Google provides them.
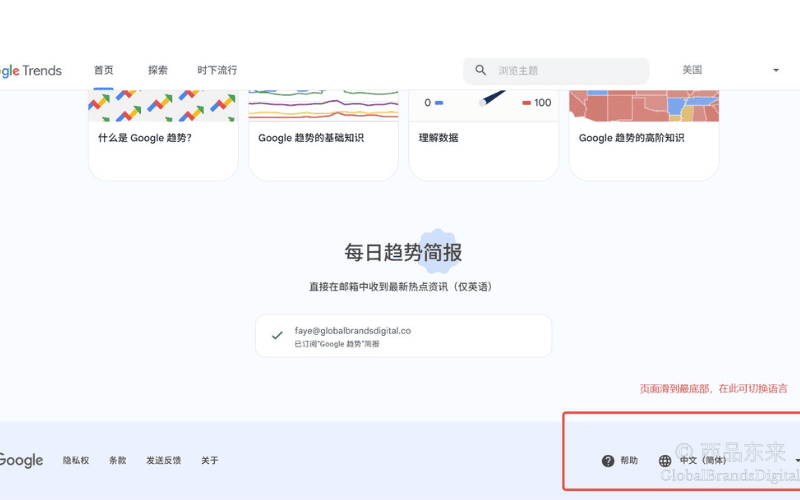
- Market selection: switch the location and language before interpreting local results.
Explore
Entering a term or topic opens Explore, the main workspace for comparing interest over time, by region and through related searches. Start by defining one research question; changing several filters at once makes the result difficult to interpret.
A search term is literal and language-specific. A topic groups related searches for the same concept across languages and spelling variants. Google's term and topic guidance explains the difference.
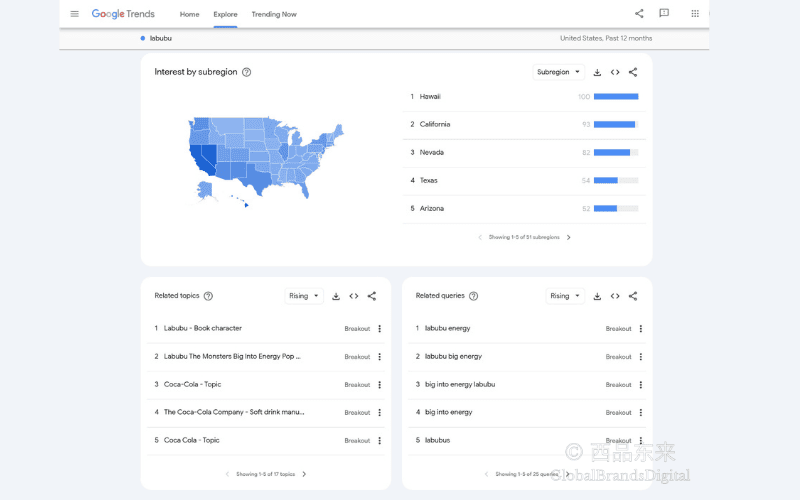
The Explore page can be read in four parts.
1. Input and controls
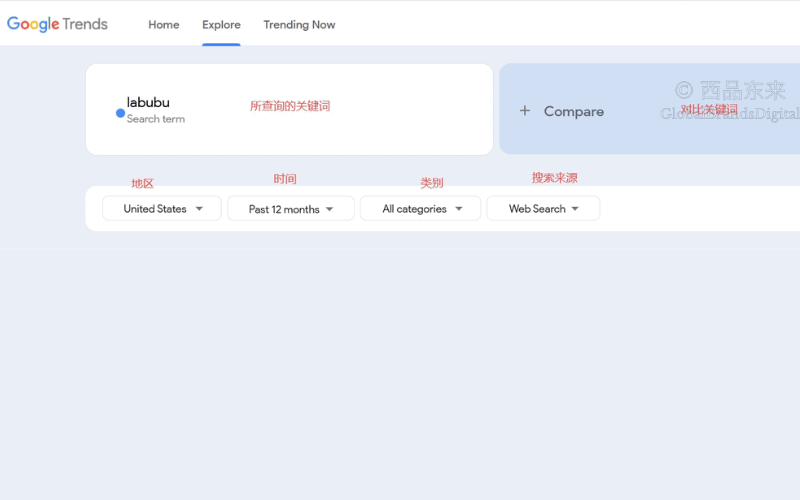
These controls define the scope of the analysis:
- Comparison: add terms or topics. Google's current comparison help documents up to eight groups with up to 50 terms in each group; classic Explore supports five groups with up to 25 terms each.
- Geography: choose worldwide, a country, a region or a more local view where data is available.
- Time: move from recent hours to custom ranges or the historical period available in Trends.
- Category: reduce ambiguity, such as Apple the company versus apple the fruit.
- Search surface: compare Web, Image, News, Shopping or YouTube search where offered.
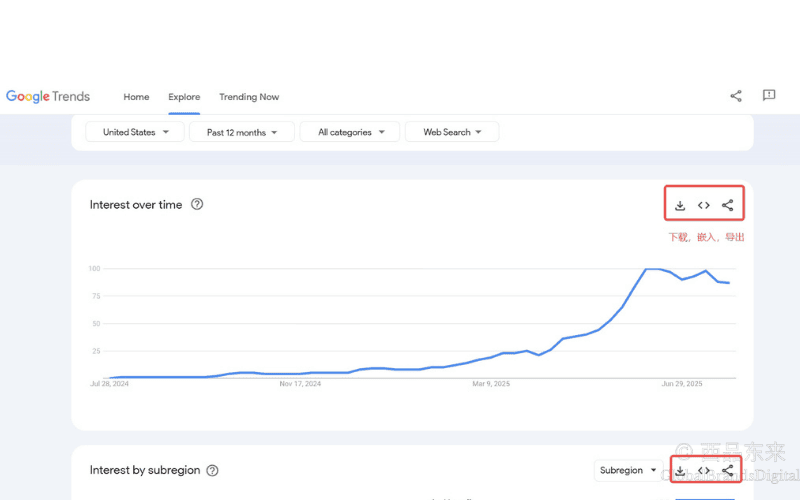
2. Main chart
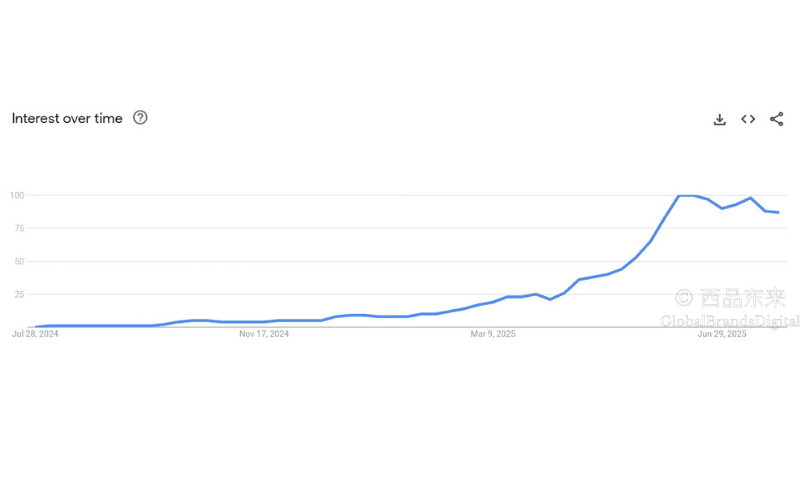
Interest over time plots the relative index for the selected settings. The chart's peak becomes 100, so changing the date, place or comparison term can rescale every point.
3. Deeper insights
The sections below the chart help identify where to investigate next:
- Interest by region: shows where the selected search represents a higher share of local search activity.
- Related topics and queries: shows other searches connected with the selected term or topic.
- Top: ranks the most frequently associated topics or queries within the selected settings.
- Rising: highlights the fastest-growing related topics or queries for that comparison.
4. Share and export
Depending on the chart and interface, Trends can let you:
- Share a link to the configured view;
- Embed a chart in a page; or
- Download CSV data for analysis in a spreadsheet or another tool.
Trending Now
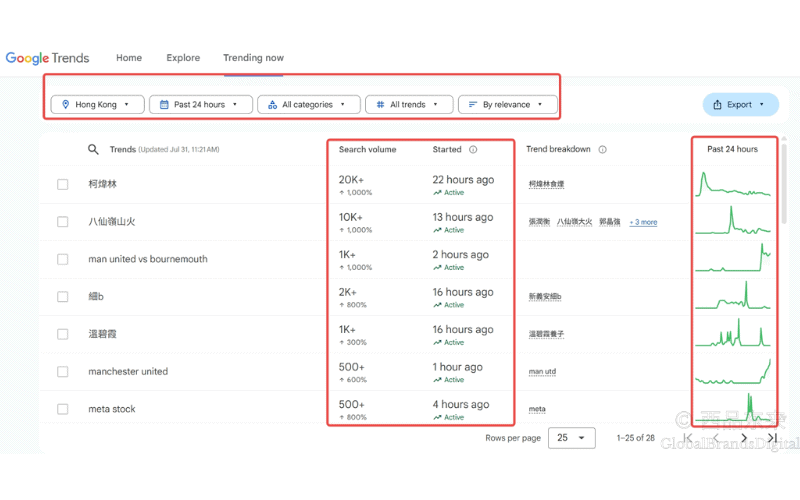
Trending Now focuses on Google Search queries that are surging recently and are connected with a news story or newsworthy cluster. It is useful for newsrooms, social teams and time-sensitive marketing, but a surge is not proof of durable demand.
Coverage and filters: Google's current Trending Now guidance covers more than 100 countries and regions where available, with views for trends that began in the past 4 hours, 24 hours, 48 hours or 7 days.
Fresh activity: data refreshes about every ten minutes on average. The interface can show trend status, bucketed search volume and when the surge began.
Trend context: charts, related queries, news and export controls help explain and retain the observation.
The Trending Now chart uses exact match. The Explore chart uses broader matching. Record which interface supplied the evidence before comparing the two.
Analyze seasonality and long-term direction
Long-term direction and seasonal variation can inform planning, but the normalized chart still needs context. Hold the term or topic, geography, category and search surface constant when comparing periods.
Analyze long-term trends
Enter an industry, product or topic, such as electric vehicles, and choose a five-year range or the period since 2004 where available.
- Rising pattern: investigate whether the category is growing and whether sales, volume and competitive evidence agree.
- Falling pattern: examine whether language, technology or customer behavior has shifted before assuming the market is disappearing.
- Stable pattern: treat it as a mature search pattern and compete through positioning, service and operational efficiency.
A chart direction is a starting hypothesis. It does not by itself determine investment, market share or future revenue.
Analyze seasonal patterns
Enter a seasonal term, such as sunscreen, and compare the past 12 months with several years of history.
- Identify peaks and troughs: mark the likely high and low periods for research, purchase and use.
- Find the lead-in: note when interest begins to rise, not only when it reaches 100.
For example, sunscreen interest may begin rising in March and peak in June or July in one market. Inventory, content and creative should be ready before the lead-in, then tested against actual conversion timing. During the trough, keep communicating with the audience. Publish off-season content only when it is useful, such as advice on protecting skin from winter sun. The pattern may be different in another hemisphere or climate.
Find new market opportunities
Trends can reveal a query or region worth investigating. It cannot confirm an untapped market or prove that customers will buy, so each opportunity needs a second evidence source.
Method 1: investigate rising and breakout queries
Enter a broad topic, such as yoga, open Related queries and switch from Top to Rising. A fast-growing query such as sound healing or rope-wall yoga may point to an emerging need or subcategory.
Check the query's starting base, persistence, region, search results and commercial relevance. A large percentage increase from a tiny base can still represent little demand.
Method 2: test regional opportunity
Enter a product that is established in one country, such as flying discs, then compare countries or use Interest by region. A weaker index elsewhere may mean an early market, different vocabulary, lower category fit or simply lower relative search share.
Validate the interpretation with local language research, logistics, regulation, price, competitors and actual sales data before entering the market.
Method 3: explore adjacent categories
Use Compare to place an established product, such as protein bars, beside an adjacent trend, such as vegan food. If both rise, test their intersection as a separate term or topic, such as vegan protein bars.
Co-movement does not prove a combined product opportunity. Review the search results and customer evidence to confirm that the intersection reflects a real need.
Method 4: turn audience questions into product hypotheses
In Related queries, look for questions beginning with how, what or why. These can reveal tasks and obstacles that existing products do not solve well.
If many people ask how to clean an air fryer quickly, a cleaner or accessory is one possible hypothesis. Customer interviews, marketplace reviews and a small commercial test should decide whether it deserves investment.
Use relative interest in keyword research
Keyword research is not just a search for the highest line. It connects wording, intent, market, page type and business value.
Compare relative interest: keep the filters fixed as you compare relevant synonyms or phrases, such as weight loss, fat loss and slimming. Check whether you selected a literal term or a cross-language topic before interpreting the result.
Understand context: use Related topics and Related queries to see the concepts and needs around the keyword. A search for coffee might connect with a brand, a brewing method or a health question, each of which requires a different page.
Use filters deliberately: geography, time, category and search surface can reveal different behavior. If home-decor inspiration is stronger in Image Search than Web Search, that may support a more visual content test.
Combine this work with international keyword research rather than treating the Trends index as search volume.
Apply Google Trends to an SEO strategy
Google Trends is a useful free input to an SEO strategy when its limitations are recorded.
Expand keyword research: compare core wording and inspect rising related queries, then verify search results, volume and intent before assigning a page.
Plan the content calendar: publish and refresh seasonal assets before interest rises. A back-to-school guide, for example, should be ready before the annual climb begins.
Support local SEO: use regional patterns to decide where local research is justified. Do not assume that a higher regional index means a larger total market.
Build topic clusters: use related topics to identify useful subtopics, then connect them through purposeful English internal links. Include only subjects that serve the reader and the site's expertise.
Use Trends for competitor research carefully
Comparing brand terms can show relative search interest within the chosen setup. It does not measure market share, customer sentiment or unaided brand awareness.
- Compare brand interest: use the correct brand term or topic and hold the market and period constant. A comparison of Xiaomi, Huawei and OPPO, for example, must use equivalent entity choices.
- Inspect regional differences: look for places where one brand has a higher relative share of search, then investigate why.
- Research spikes: compare a sudden peak with product launches, promotions, controversies or news. Timing is evidence of association, not proof of cause.
Apply Trends to cross-border ecommerce
For cross-border sellers, Trends can support market screening, product research and localized planning.
- Screen markets: compare a product across candidate countries, such as the United States, United Kingdom and Germany, then check absolute scale, margins, regulation and fulfillment.
- Test product direction: look for persistent growth rather than one isolated spike and compare it with marketplace and sales evidence.
- Plan for local seasons: map holidays, climate and shopping periods for each country before scheduling inventory and promotion.
- Localize wording: inspect local related queries, then validate the vocabulary in live search results and with native-market review.
Use Trends to improve marketing timing
Marketing works best when the message, market and timing match a real audience need. Trends can help with the timing, but it cannot replace positioning or customer research.
Enter before the peak: launch when interest begins to rise rather than waiting until the chart reaches its maximum.
Respond to relevant trends: use Trending Now or Rising queries only when the connection to the brand is genuine. Avoid forcing a product into an unrelated or sensitive news event.
Test a creative premise: compare interest in the idea and its language, then use campaign tests to measure whether the message actually works.
Coordinate paid campaigns and content
Paid media and organic content both benefit from better timing and language. Trends provides a directional input, not a promise that a query will convert.
Optimize paid-search timing
- Select language: compare candidate terms, then use Keyword Planner and real query data for volume, cost and match-type decisions.
- Test regional allocation: regional interest can suggest where to test budget, but performance data should decide whether the test expands.
- Improve copy: related queries can supply customer language; ad policy, accuracy and landing-page fit still govern its use.
Optimize the content calendar
- Validate a topic: check whether interest is sustained, seasonal or a short-lived spike before committing production time.
- Choose a format: compare Web, Image and YouTube search where available, then consider the actual search results and audience task.
- Investigate gaps: a rising query with weak current coverage may reveal a gap. Being useful and relevant matters more than being first.
Turn accepted findings into a brief through evidence-led content planning and measure the result with website analytics.
Practical techniques for efficient analysis
Use punctuation and groups deliberately
Google's current Trends search tips define the following behavior. This corrects several outdated assumptions in older tutorials.
| Syntax | How to enter it | What Trends includes | Example |
|---|---|---|---|
| No operator | fitness | Searches containing the entered term, possibly with other words. Misspellings, spelling variants, synonyms, plurals and singulars are not added automatically. | Can include how to improve fitness or fitness classes near me. |
| Double quotation marks | "sugar-free cola" | Searches containing the exact phrase, possibly with words before or after it. | Can include best sugar-free cola, but not cola that is sugar free. |
| Plus sign | yoga + pilates | Searches containing either term. The plus sign works as OR, not as a requirement that both words appear. | Combines interest in searches for yoga or pilates. |
| Minus sign | apple -fruit | Searches that contain the first term and exclude the word immediately after the minus sign. A space after the hyphen changes the behavior. | apple -fruit excludes fruit; apple - fruit does not. |
Why interest can display as zero
A zero usually means the term has too little data for the selected period and place. Google also adds statistical noise, which is most noticeable for queries with little or no interest.
Try a broader term or topic, a longer time range, or a wider geography. Use Keyword Planner or another source if the decision requires an estimated search count.
How to handle volatile long-tail charts
Low-volume queries can produce sparse or noisy charts. Do not treat a one-off spike as evidence of individual searches or a new market.
Compare the long-tail query with its parent topic, lengthen the period and combine clearly defined alternatives with the plus operator when that matches the research question.
Reduce information overload
Begin with a concrete question, such as When does interest in this product begin to rise in Canada? Keep a record of the term or topic, market, period, category and search surface.
Review the long-term pattern first, then narrow the time range or region. This prevents an interesting chart from replacing the decision you actually need to make.
Compare countries and regions consistently
Use the location controls or compare locations with equivalent settings. URL parameters such as geo=US can make a view reproducible, but the visible interface and saved export should remain the primary record.
A regional index expresses relative concentration. It must not be used as a stand-alone estimate of population, total searches or sales.
Read the search-interest index correctly
The index shows relative interest in the selected comparison. A higher number means a higher share of search activity for that setup, not a fixed number of searches.
If you change the comparison term, date or geography, Trends can rescale the chart. Save or export the settings used for any decision.
Use Trends for product research
Enter the product term or topic and examine its long-term direction, seasonal pattern, related queries and regional distribution. Then compare the chart with marketplace demand, margins and customer evidence.
A stable or rising line is encouraging only when the product can also meet a real need at a viable cost. A falling line may reflect new language rather than a disappearing category.
Build a reproducible Trends analysis
Record the exact input, whether it is a term or topic, every filter, the date of analysis and the exported chart or CSV. State what the data can and cannot support.
Then classify the pattern as rising, falling, stable, seasonal or inconclusive and name the next evidence source needed. This makes the analysis reviewable rather than impressionistic.
Know when to use another keyword tool
Google Keyword Planner can provide keyword ideas and advertiser-oriented volume and competition estimates. Search Console shows queries for an existing site. Other research tools may add SERP, difficulty or competitor estimates.
Use Trends for direction, timing and relative comparison; use the tool that matches the remaining question for scale, cost, ranking or conversion.
Google Trends is most valuable when it narrows uncertainty rather than pretending to remove it. If you need help turning demand evidence into an international search program, review our SEO services.