
On this pageTable of contents+
- What Is Website Traffic?
- How to Check Website Traffic
- Step 1: Define the Question
- Step 2: Choose an Appropriate Traffic Tool
- Step 3: Focus on the Core Dimensions
- Common Tools for Website Traffic Analysis
- Google's First-Party Traffic Tools
- International Third-Party Traffic Tools
- 3. Open-Source and Self-Hosted Analytics Tools
- 4. Enterprise Traffic Analytics for Large Sites
- How to Interpret Website Traffic Data
- Overall Trend
- Traffic Sources
- User Behavior
- Conversions
- Device and Geographic Distribution
- How to Increase Website Traffic
- Research and Map Keywords
- Publish Useful Content Consistently
- Improve User Experience
- Build Relevant Links
- Promote Content Across Channels
- Monitor and Improve Continuously

Have you worked on SEO for months without knowing how many real visitors your site receives each day? Without traffic data, it is hard to tell whether optimization is working. Without knowing where competitors get their traffic, it is equally hard to identify a useful direction.
That is why website traffic analysis matters. It shows how a site is performing and provides evidence for the next round of optimization.
This article starts with the meaning of website traffic, then explains how to check it, which tools are commonly used, and how to interpret and apply the data.
What Is Website Traffic?
Website traffic usually means the number of people who visit a site and what they do during a defined period. It is one of the clearest indicators of website performance. Whether you run an ecommerce store, an independent site or a content publication, measuring visits and examining the traffic mix are basic SEO tasks. Common metrics include:
- Visits or sessions: the number of times users visit the website during a set period.
- Users or unique visitors: the number of distinct users who visit during the reporting period, indicating the size of the actual audience.
- Page views: the total number of pages viewed by all visitors, which can indicate how widely content is being consumed.
- Bounce rate: the share of sessions that are not engaged. A high rate can signal a mismatch between the page and visitor expectations, although it must be interpreted in context.
- Average engagement time or session duration: how long users remain engaged with the site on average.
- Conversion rate: the percentage of visitors who complete a target action, such as ordering, registering or making an enquiry.
Together, these basic metrics show both the site's reach and how visitors behave and convert.
To collect the data, however, you need a suitable first-party analytics setup or an estimation tool. The following steps explain where to begin.
How to Check Website Traffic
Website traffic analysis is not a single action. It can be divided into several steps.
Step 1: Define the Question
Before choosing a tool, decide what you need to learn:
- Do you need the site's total visits?
- Do you want to compare estimated traffic and rankings across competitors?
- Or do you need page-level performance data?
A clear question makes it easier to choose the right tool and metrics.
Step 2: Choose an Appropriate Traffic Tool
There are two common approaches:
- First-party tools: use Google or another analytics platform installed on your own site for the most direct measurement of your traffic.
- Third-party tools: use external estimates for market comparisons and competitor research.
Step 3: Focus on the Core Dimensions
Whichever approach you use, focus on these dimensions:
- Total visits or sessions
- Users or unique visitors
- Page views
- Traffic sources, including organic, paid, direct, referral and social traffic
- Behavior and outcome metrics, including engagement, bounce rate and conversions
These metrics help you assess the site's health and identify the channels that deliver the most valuable traffic.
Common Tools for Website Traffic Analysis
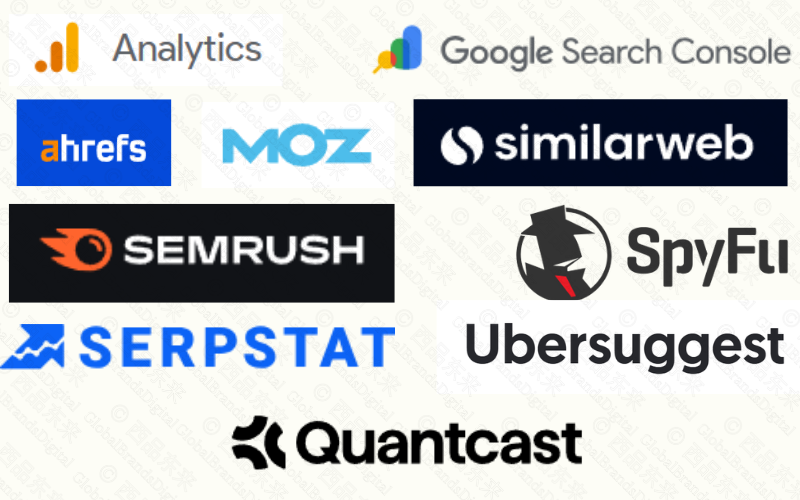
Many traffic-analysis products are available. The source article groups the following commonly used tools by purpose. Interfaces, limits and pricing can change, so verify the current product documentation before making a purchasing decision.
Google's First-Party Traffic Tools
1. Google Analytics 4 (GA4)
Google Analytics 4 is a widely used traffic-analysis platform. A standard version is available without charge; Analytics 360 is the enterprise offering. GA4 can measure acquisition channels, page and screen activity, engagement and configured conversion events. It is suitable for ecommerce, content and B2B sites that need ongoing first-party measurement.
How to use it
- Open the Reports workspace to review traffic, users and trends for the selected period.
- Use the Acquisition reports to compare organic search, advertising, social, referral and other channels.
- Use Pages and screens to compare views, users and engagement across content.
Website: https://analytics.google.com/
2. Google Search Console (GSC)
Google Search Console is Google's free search-performance and indexing tool. It reports clicks, impressions, average position and click-through rate for queries and pages, and it surfaces indexing information and page issues. It is useful for monitoring organic-search visibility and identifying query and page opportunities.
How to use it
- Open the Performance report to review clicks, impressions, click-through rate and average position.
- Use the Queries view to find searches that generate impressions or clicks and identify terms that merit further work.
- Use the Pages view to see which URLs receive the most search traffic and which pages may need attention.
- Use the Page indexing report and URL Inspection tool to investigate whether important pages are indexed.
Website: https://search.google.com/search-console/
International Third-Party Traffic Tools
1. Similarweb
Similarweb provides traffic estimates, channel-mix data, audience geography and competitive comparisons. It offers limited free access and paid products. Because its competitor figures are modeled estimates rather than first-party measurements, use them for directional market research rather than as exact analytics.
How to use it
- Enter a domain to review estimated traffic, rankings and principal acquisition channels.
- Compare two or more sites to study the shape of traffic within a market.
- Use category benchmarks to compare a site with others in the same sector.
Website: https://www.similarweb.com/
2. Ahrefs
Ahrefs is a paid SEO platform known for backlink and keyword research. Its estimates can be used to compare organic-search visibility, keywords and links across sites. These estimates are useful for SEO and competitor research but do not replace a site's own analytics.
How to use it
- Enter a domain in Site Explorer to review estimated organic traffic, keyword rankings and backlinks.
- Open Organic keywords to see which queries are associated with the site's estimated search traffic.
- Compare sites' organic visibility and link profiles to identify possible opportunities.
Website: https://ahrefs.com/
3. Semrush
Semrush is a paid SEO and search-marketing platform that combines traffic estimates, keyword research, rank tracking and advertising data. It can help teams monitor their own search footprint and compare it with competitors.
How to use it
- Enter a domain to review estimated traffic trends, channels and keyword data.
- Use Traffic Analytics to compare estimated visits and acquisition sources across competitors.
- Use Keyword Gap to identify queries for which competitors have stronger visibility.
Website: https://www.semrush.com/
4. Moz Pro
Moz Pro is a paid SEO platform that provides keyword research, rank tracking and proprietary authority metrics such as Domain Authority and Page Authority. It can support comparisons of rankings, links and estimated organic visibility.
How to use it
- Use Keyword Explorer to review estimated search demand and competition.
- Use Link Explorer to inspect authority metrics and backlinks.
- Use rank tracking to monitor how target keywords change over time.
Website: https://moz.com/products/pro
5. SpyFu
SpyFu focuses on keyword and PPC competitor research. Its paid products show modeled organic-keyword and advertising data that can support keyword comparisons and campaign research.
How to use it
- Enter a competitor's domain to review its reported organic and paid keywords.
- Compare paid-search data across sites when planning or reviewing advertising budgets.
- Use competitor keyword estimates as leads for your own research rather than as confirmed traffic totals.
Website: https://www.spyfu.com/
6. Serpstat
Serpstat is a paid SEO platform for traffic estimates, keyword research, rank tracking, site auditing and backlink analysis. The source presents it as an option for small and medium-sized businesses comparing all-in-one platforms.
How to use it
- Enter a site to review estimated organic traffic and keyword rankings.
- Use Site Audit to identify technical issues that may affect search performance.
- Compare keyword rankings to find areas where organic visibility may improve.
Website: https://serpstat.com/
7. Ubersuggest
Ubersuggest, developed by Neil Patel, provides traffic estimates, keyword research and ranking data through free and paid access tiers. It is aimed at individual site owners and smaller teams.
How to use it
- Enter a domain to review estimated traffic, leading keywords and top pages.
- Use Keyword Ideas to research terms with traffic potential.
- Use Top Pages to study which competitor pages are estimated to attract the most search traffic.
Website: https://neilpatel.com/ubersuggest/
8. Quantcast
Quantcast focuses on audience intelligence and advertising. The source describes it as a tool for estimating audience scale, demographics, interests and trends for marketing analysis. Availability and coverage vary, so check the current product before relying on a specific report.
How to use it
- Review the available audience-scale and demographic information for a site or market.
- Compare audience profiles across available sources to inform advertising decisions.
- Use trend data as one input when investigating possible areas of growth.
Website: https://www.quantcast.com/
3. Open-Source and Self-Hosted Analytics Tools
1. Matomo (formerly Piwik)
Matomo is an open-source web-analytics platform available as a self-hosted product or cloud service. It can measure visits, acquisition channels and user behavior, with a strong emphasis on data control and privacy. It suits organizations that need more control over how analytics data is hosted and governed.
How to use it
- Install Matomo on a server or register for its cloud service.
- Use the dashboard to review visits, acquisition channels and popular pages.
- Configure goals or conversions to study paths and outcomes.
Website: https://matomo.org/
2. AWStats
AWStats is a free, open-source log-analysis tool. It processes server log files to report visits, page views, visitor countries, browsers and crawler activity. Technical teams often use it to understand server traffic independently of client-side analytics scripts.
How to use it
- Configure AWStats on the server and process access logs on a regular schedule.
- Use its reports to review visits, page views, country distribution and crawler activity.
- Combine log evidence with SEO data to examine how search-engine crawlers access the site.
Website: https://awstats.sourceforge.io/
3. Yandex Metrica
Yandex Metrica is an analytics product from Yandex. The source describes it as a free alternative with traffic-source reports, heatmaps and session replay. Those features can help teams observe how users click, scroll and move through a page.
How to use it
- Create an account and install the tracking code on the site.
- Use the dashboard to review traffic, acquisition channels and user paths.
- Use heatmaps and session replay, with appropriate privacy controls, to investigate interaction problems.
Website: https://metrica.yandex.com/

4. Enterprise Traffic Analytics for Large Sites
1. Adobe Analytics
Adobe Analytics is part of Adobe Experience Cloud. It is a paid enterprise product for advanced traffic measurement, conversion analysis, audience segmentation and multi-channel attribution, commonly used by large ecommerce and brand sites.
How to use it
- Deploy the required Adobe Analytics script or SDK.
- Use the workspace to review traffic trends, segments and conversion paths.
- Connect the analysis with other Adobe marketing products where the wider implementation supports it.
Website: https://business.adobe.com/products/analytics/adobe-analytics.html
2. Chartbeat
Chartbeat is a paid real-time analytics product used by media and news organizations. It can show how many people are currently reading, which articles they are viewing and how they engage, helping editorial teams respond to live audience behavior.
How to use it
- Install Chartbeat's tracking code on the site.
- Monitor current visitors and page engagement in real time.
- Use the data to inform editorial decisions, such as promoting an article that is attracting sustained interest.
Website: https://chartbeat.com/
3. Parse.ly
Parse.ly is a paid content-analytics product for publishers and content-led organizations. It measures article performance, audience engagement and content distribution.
How to use it
- Install the Parse.ly tracking code.
- Review article views, engagement time and distribution signals in the dashboard.
- Analyze which topics and formats attract organic traffic, then use the findings to guide editorial planning.
Website: https://www.parse.ly/
How to Interpret Website Traffic Data
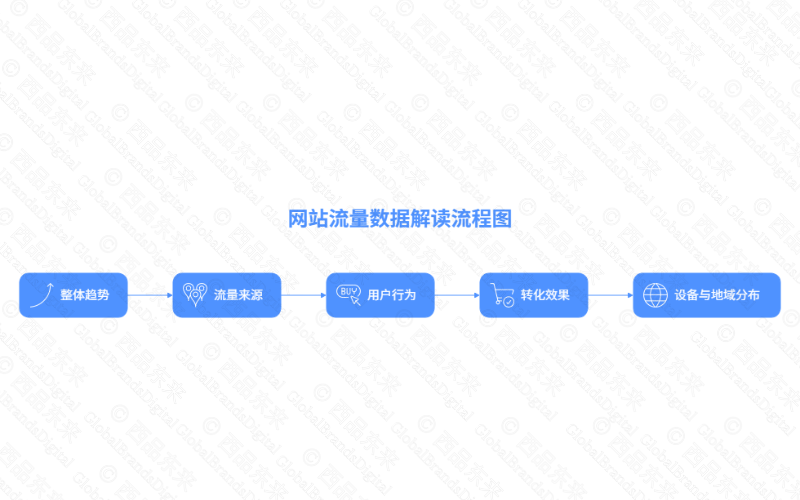
A dashboard can contain more numbers than a team knows how to use. Five dimensions provide a practical way to understand performance.
Overall Trend
- Visits or sessions: sustained growth can indicate expanding reach. A sharp decline warrants checks for technical problems, lost indexation, ranking changes or weaker acquisition channels.
- Users or unique visitors: this indicates audience size. If users increase but conversions do not, investigate the experience, offer and content-market fit.
Review weekly and monthly trends rather than drawing conclusions from a single day's movement.
Traffic Sources
- Organic search: visits from search engines. If organic visibility is a strategic goal and this share is small, investigate search demand, indexation, rankings and content coverage.
- Paid search: visits from advertising. Evaluate it with conversion and cost data, not clicks alone.
- Direct: sessions attributed to direct entry or an unrecognized source. It can include brand-led visits, but it should not be treated as a pure measure of brand awareness.
- Referral: visits from links on other sites. This can reveal valuable citations, partnerships and referral sources.
- Social: visits from services such as Facebook, LinkedIn and X. Use it to assess how distribution contributes to traffic and outcomes.
Compare channel shares and trends, then prioritize the sources that create the strongest return for the business.
User Behavior
- Bounce rate: a high rate can indicate that the page does not match expectations or has experience problems, but its meaning depends on the page type and analytics configuration.
- Average engagement time: longer engagement can show that visitors are consuming the content; short engagement may justify a closer look at relevance and usability.
- Views per session: the number of pages viewed during a visit. If visitors repeatedly stop after one page, review the journey and internal navigation.
Compare high-performing and weak pages, then use the differences to guide content and experience changes.
Conversions
- Conversion rate: the share of visitors who complete a defined action, such as ordering, registering or making an enquiry.
- Conversion path: the sequence from the entry page to the page or event where the action is completed.
- Drop-off point: if many visitors leave at a cart or form, review the checkout flow, form requirements and technical errors.
Traffic volume alone is not enough. Evaluate whether visits produce outcomes that matter to the organization.
Device and Geographic Distribution
- Device type: compare desktop and mobile performance. If mobile traffic is high but engagement or conversion is weak, review the mobile experience.
- Geography: identify the countries and regions that generate visits and compare them with the intended market.
Use business goals to interpret the data. For example, an international ecommerce operation should monitor traffic and outcomes in each target country.
In short, interpret traffic data by asking four questions:
- What is the trend, and what does it say about overall health?
- Which sources deliver the most valuable traffic?
- How do visitors behave, and where does the experience need improvement?
- Do visits produce conversions or other valuable outcomes?
How to Increase Website Traffic
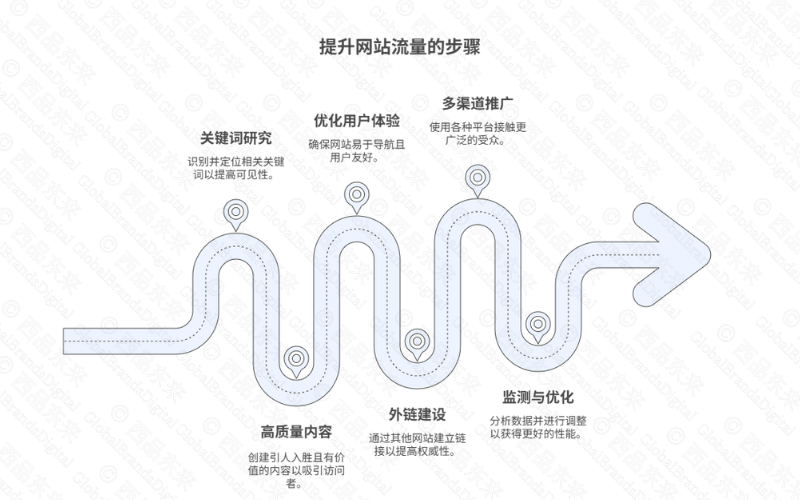
Data describes the current position; optimization is what changes it. The following methods turn the analysis into action.
Research and Map Keywords
- Use research tools such as Ahrefs, Semrush and Ubersuggest to investigate relevant demand and competition.
- Place terms naturally in titles, descriptions, body copy and internal links. Avoid keyword stuffing.
- Prioritize long-tail queries. Their individual volume may be smaller, but their intent can be more specific and their competition lower.
Publish Useful Content Consistently
- Publish articles, case studies and industry analysis that match real search intent.
- Use first-party traffic data to identify strong articles, then expand related topics into a coherent content cluster.
- Let search-performance data guide new topics. If a page earns meaningful impressions or clicks, investigate adjacent questions that the same audience asks.
Improve User Experience
- Improve site speed: slow pages can weaken engagement and conversion.
- Design for mobile: ensure pages load quickly and remain readable on smaller screens.
- Use clear navigation so visitors can find the next relevant step.
- Use controlled A/B tests to compare design or content options with measurable outcomes.
Build Relevant Links
- Contact relevant industry sites where there is a genuine editorial reason to reference the content.
- Publish useful material that other sites may choose to cite.
- Earn links through digital PR, guest contributions and partnerships. Relevant links can bring referral traffic as well as support search visibility.
Promote Content Across Channels
- Distribute useful content through suitable platforms such as LinkedIn, Facebook and X.
- Use email to bring interested readers back to new or updated resources.
- Work with relevant publications or creators where the collaboration fits the audience.
Monitor and Improve Continuously
- Use Google Analytics and Search Console to review first-party traffic and search performance on a regular schedule.
- Identify the sources that generate the strongest outcomes and allocate effort accordingly.
- Use the evidence to adjust the SEO plan and repeat the cycle.
Website traffic is an important indicator of site performance, but it becomes useful only when a team connects measurement to action. Define what traffic means, choose an appropriate first-party or estimation tool, interpret the data, and turn the findings into changes to content, keyword mapping, user experience and distribution.
Is your website traffic stuck?
- Do you know how many real visitors your site receives each day?
- Do you know which channels send traffic to your competitors?
- Do you want an SEO growth plan designed to generate qualified enquiries and orders?
Start by using the tools in this article to review your website's traffic and search visibility.
If repeated trial and error is consuming your time, contact us. We can review the current site and provide a traffic diagnosis with an actionable SEO plan.
Do not wait for traffic to disappear before investigating the cause. Build the measurement and improvement process early.